
The Second Curve
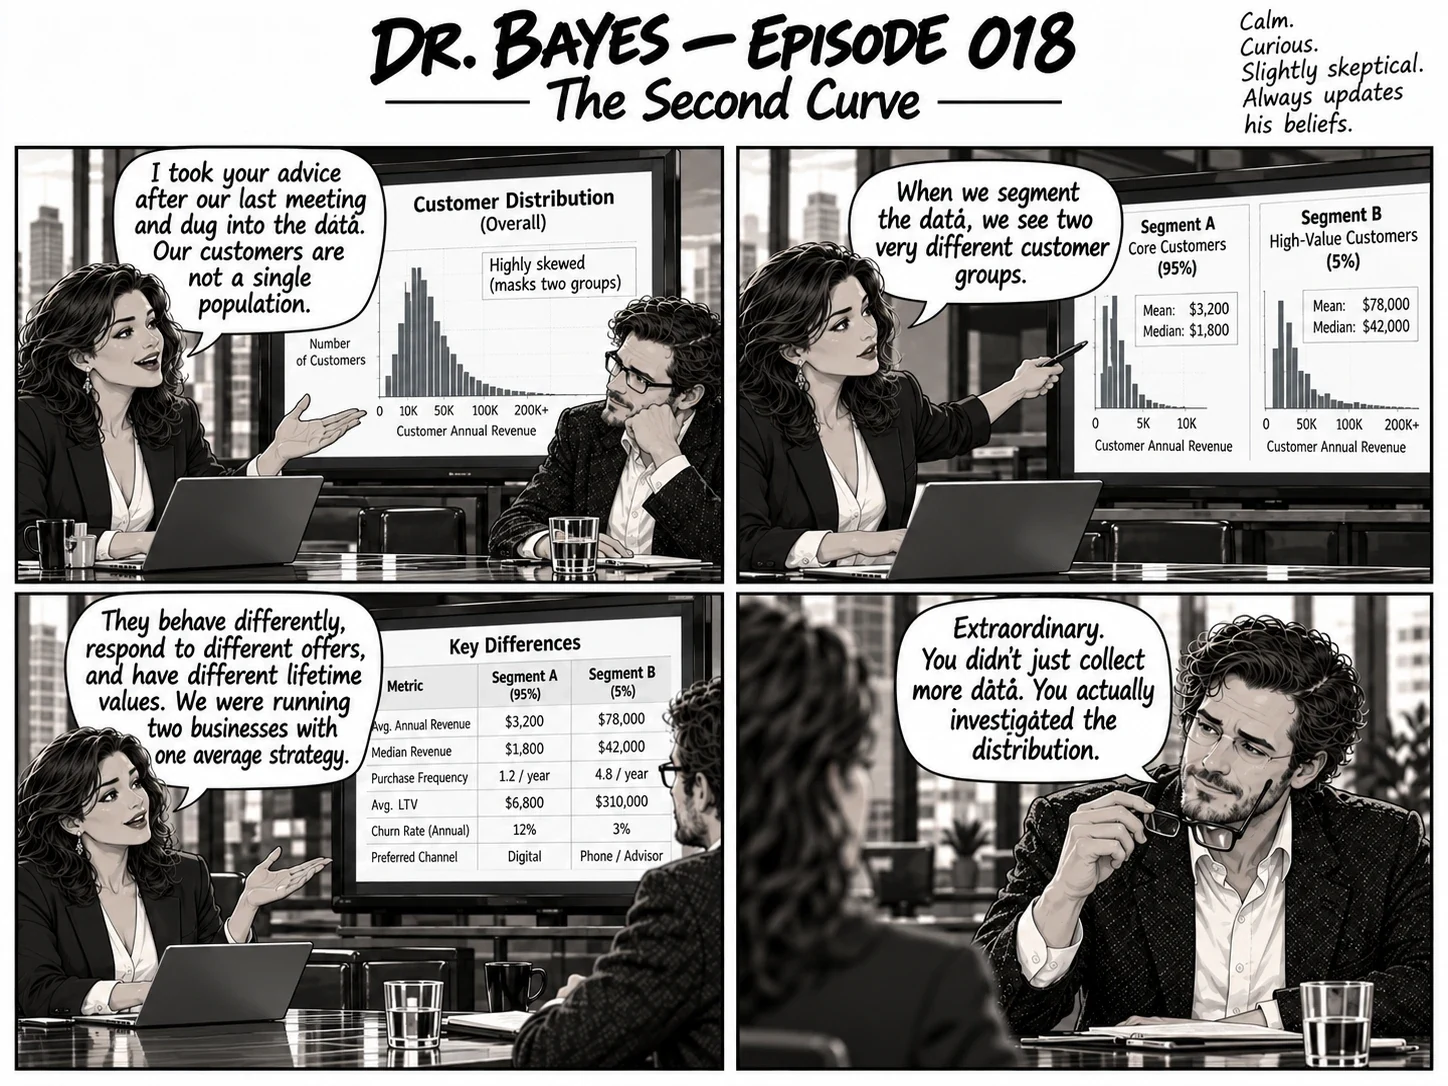
One average, two businesses. Elena Reyes returns after investigating her customer data and discovers two distinct customer groups behind one skewed distribution.
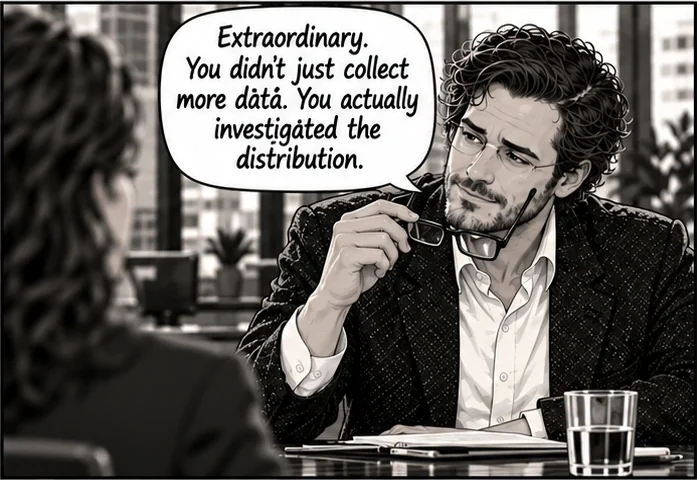
Behind the joke.
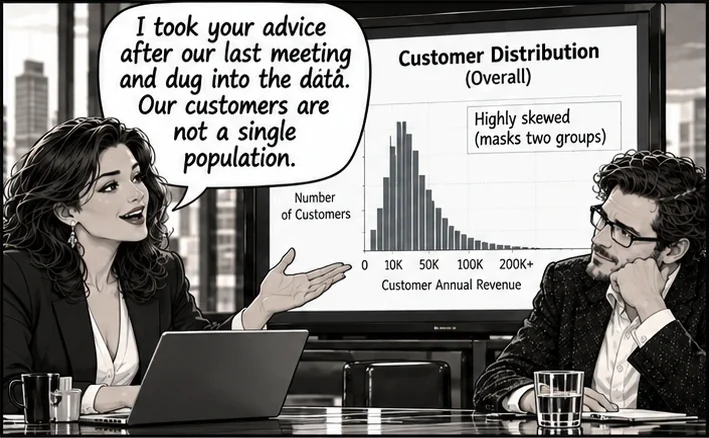
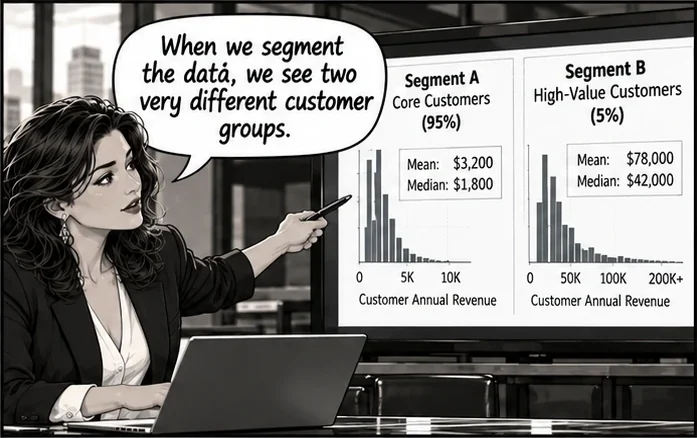
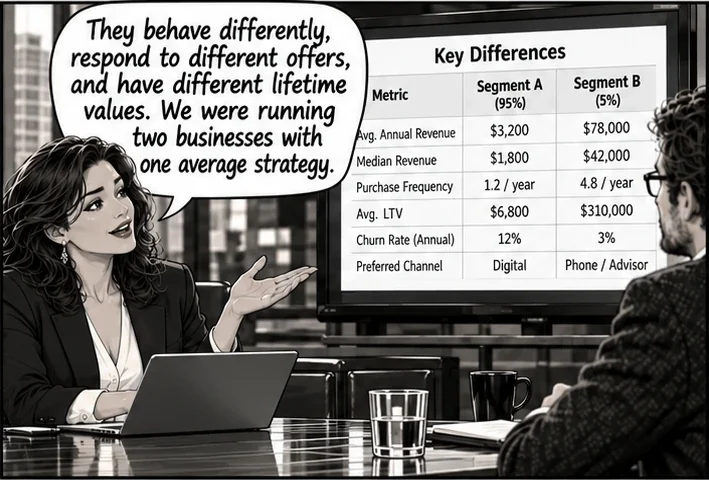
A single skewed histogram can hide a mixture of groups. Elena's split separates core customers (95%, median revenue $1,800) from high-value customers (5%, median $42,000) who buy more often, churn less and prefer a phone or advisor. Each group needs its own strategy; averaging them produces a plan that suits neither. Dr. Bayes is impressed because she examined the distribution instead of simply adding data.
The transcript.
For readers who prefer dialogue without zooming in.
Read the dialogue ↘
Elena Reyes: I took your advice after our last meeting and dug into the data. Our customers are not a single population.
Elena Reyes: When we segment the data, we see two very different customer groups.
Elena Reyes: They behave differently, respond to different offers, and have different lifetime values. We were running two businesses with one average strategy.
Dr. Bayes: Extraordinary. You didn't just collect more data. You actually investigated the distribution.