
The Bell Curve
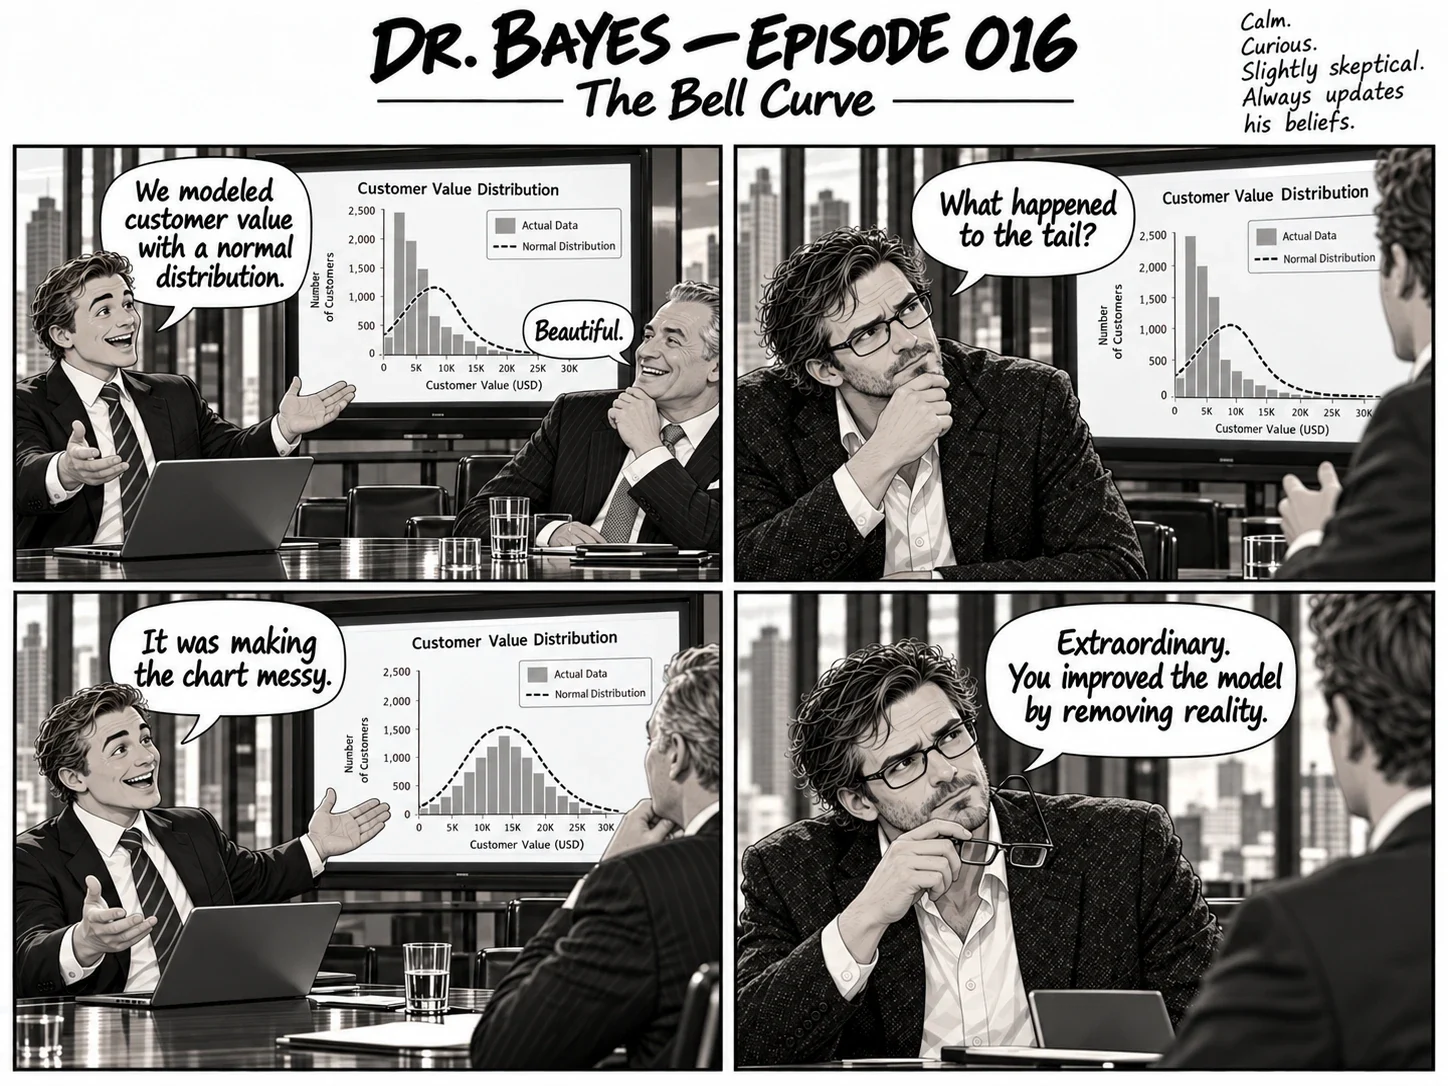
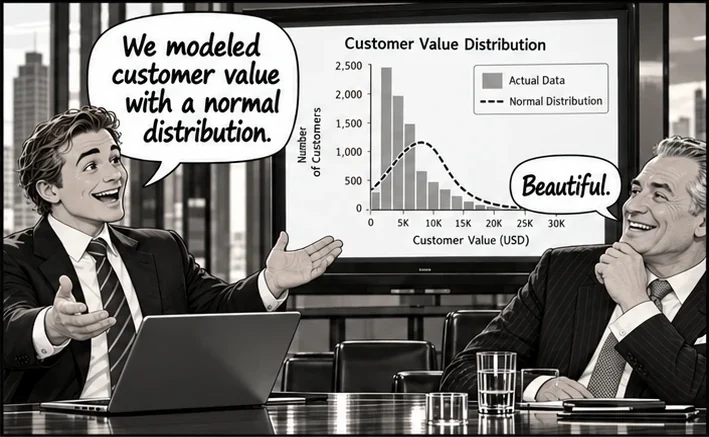
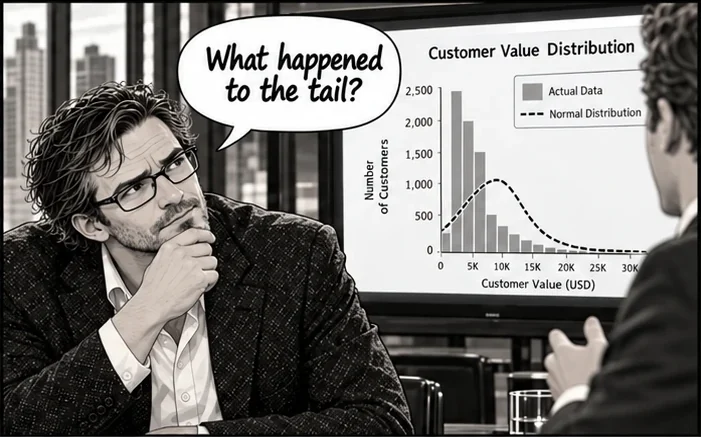
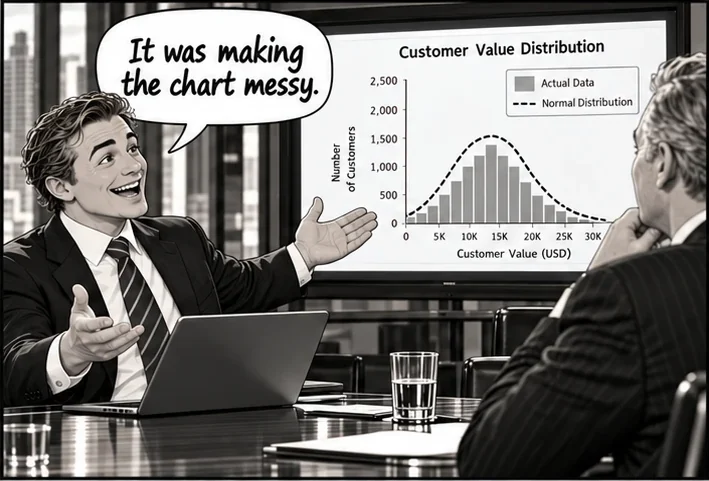
Tidying the data until it agrees. An analyst models customer value with a normal distribution, then removes the long tail to make it look better. Dr. Bayes notices what went missing.

Behind the joke.
A normal distribution is symmetric with thin tails, so it rarely suits customer value, which cannot fall below zero and usually has a long right tail. When a model fits badly, the fix is to choose a distribution that matches the data, such as a lognormal or gamma, not to delete the observations that disagree. The tail is often where much of the revenue sits.
The transcript.
For readers who prefer dialogue without zooming in.
Read the dialogue ↘
Analyst: We modeled customer value with a normal distribution.
Executive: Beautiful.
Dr. Bayes: What happened to the tail?
Analyst: It was making the chart messy.
Dr. Bayes: Extraordinary. You improved the model by removing reality.